Anomaly Stock Detection System
Results
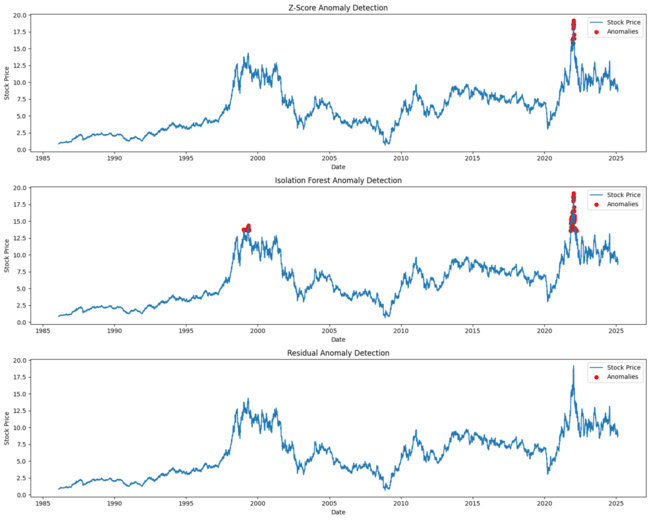
The chart above displays the plotted result of the Z-score, Isolation Forest, and Residual Anomaly Detection.
The IC of 0.072 indicates the model has statistically significant predictive power. In quantitative finance, an IC > 0.05 is generally considered strong performance.
What It Does
The model takes 60 days of historical stock data (prices, volume, technical indicators) and predicts whether the stock will go up or down the next day. It uses two LSTM layers to learn temporal patterns in the data.
Features Used
The model uses 30+ features including:
- Price momentum: RSI, MACD, lagged returns
- Volatility indicators: Bollinger Bands, ATR, realized volatility
- Trend indicators: Moving averages, ADX
- Volume signals: Volume ratio, OBV
Model Architecture
Input: 60 days × N features
↓
LSTM: 64 units
Dropout: 0.2
↓
LSTM: 32 units
↓
Dense: 1 output (predicted return)
Trained for 30 epochs with Adam optimizer and MSE loss.
Why LSTM?
Stock prices have temporal dependencies - patterns from previous days affect future prices. LSTM's gating mechanism allows it to remember relevant information across the 60-day sequence while filtering out noise. This makes it better suited than simpler models like linear regression or random forests which ignore temporal ordering.
Setup & Usage
pip install -r requirements.txt
jupyter notebook project.ipynb
Data Leakage Prevention
- Train/test split is purely temporal (train ends before test begins)
- Features are created separately for train and test sets
- Scaling parameters learned only from training data
- All features at time t use only data up to time t-1
Requirements
- Python 3.8+
- TensorFlow 2.15+
- Scikit-learn
- Pandas
- Yfinance